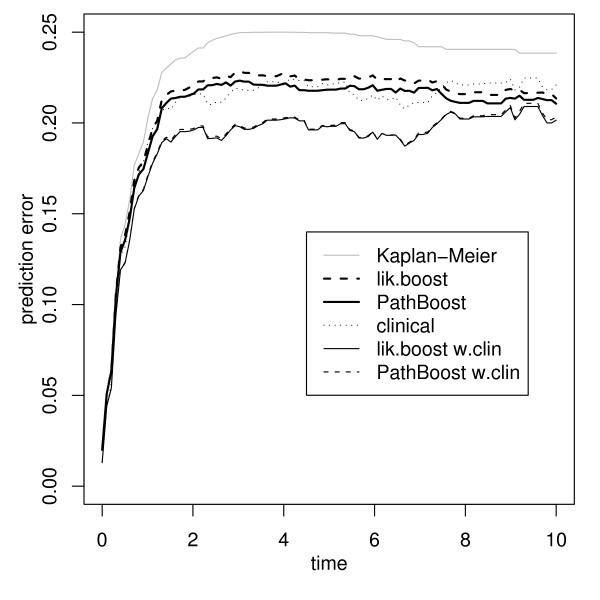
Figure 2.
Prediction error curves for the DLBCL data. Bootstrap .632+ prediction error curve estimates for boosting without pathway information (dashed curves) and PathBoost (solid curves), applied to DLBCL data, without (thick curves) and with clinical covariates (thin curves). The Kaplan-Meier benchmark (grey curve) and a purely clinical model (dotted curve) are given as a reference.

