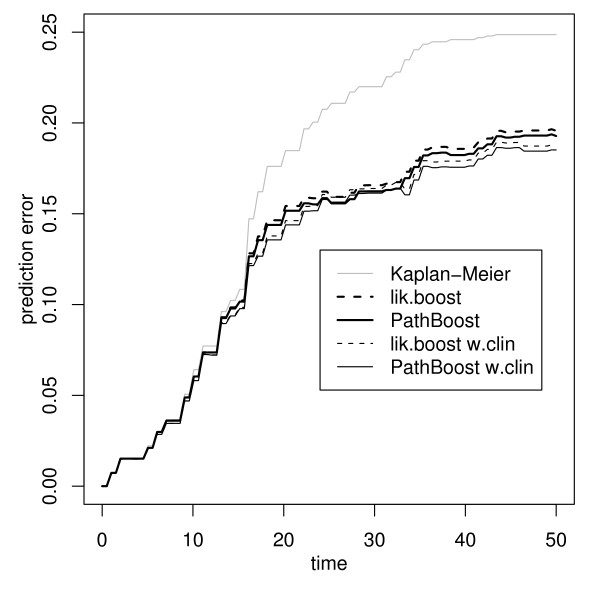
Figure 3.
Prediction error curves for the ovarian cancer data. Bootstrap .632+ prediction error curve estimates for boosting without pathway information (dashed curves) and PathBoost (solid curves), applied to ovarian cancer data, without (thick curves) and with clinical covariates (thin curves). The Kaplan-Meier benchmark (grey curve) is given as a reference.

