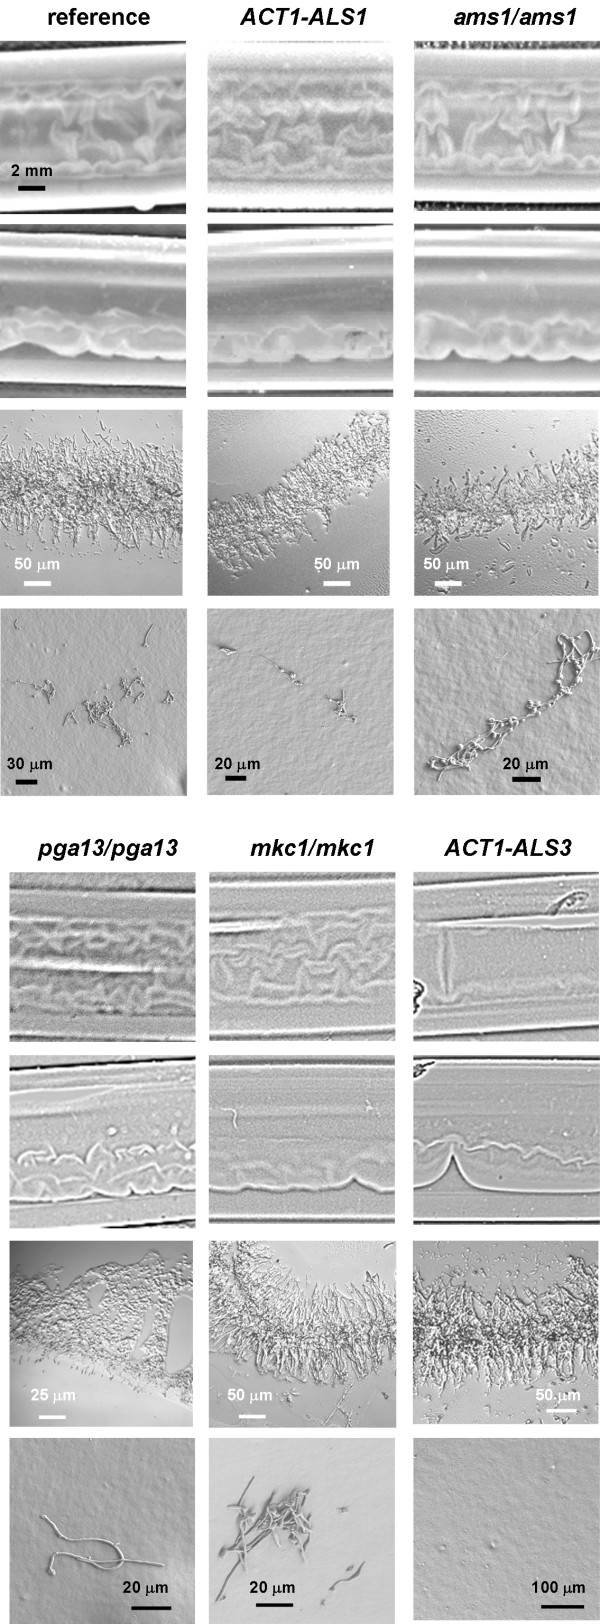
Figure 10.
Detachment phenotypes of selected mutants. All data presented are for 3 h biofilms. The top row of panels in each set are digital camera images (top view, first row; side view, second row). The third row in each set are cryosections and the forth row are SEM images of the surface after draining the tubing. SEM images show the most densely colonized regions of the surface that could be found. The biofilm formed from the pga13/pga13 mutant was relatively fragile and this may have contributed to the altered structure of the cryosections. In terms of gross structure the most pronounced differences were seen in the ACT1-ALS3 construct which exhibited fewer regions of detachment that were relatively more displaced from the surface.

