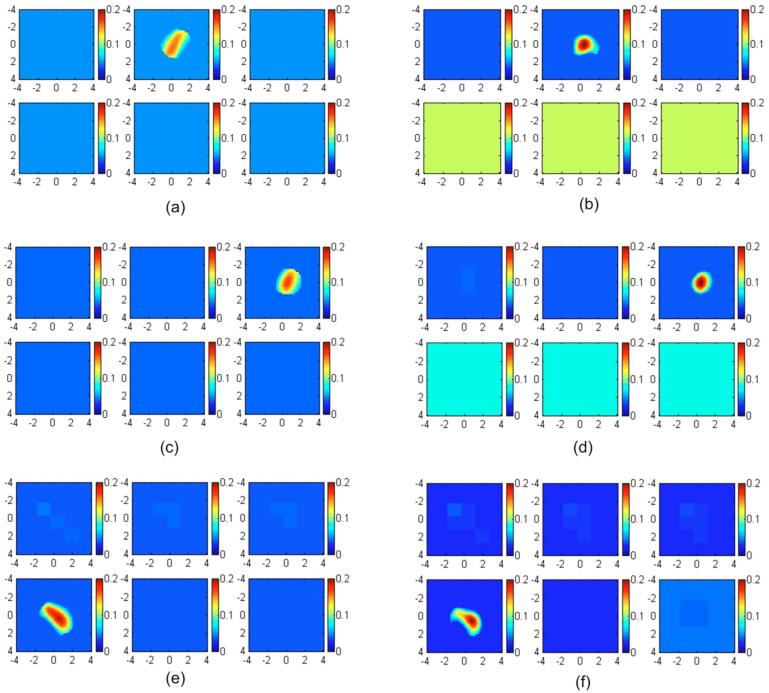
Fig. 7.
Reconstructed absorption maps of phantom 1 placed in Intralipid layers of 0.9, 1.5, and 1.8 cm depth. The second layer silicon phantom was located at 1.5, 2.1, and 2.4 cm depth, respectively. (a) and (b), The target center was located at 0.9 cm depth. The first slice is the spatial x-y image of 8×8 cm obtained at a 0.4-cm depth, and the second and third slices at 0.9 and 1.4 cm, respectively. (c) and (d) The target center was located at a 1.5-cm depth. The first slice is the spatial x-y image of 8×8 cm obtained at a 0.5-cm depth, and the second and third cross sections at 1.0 and 1.5 cm, respectively. (e) and (f). The target center was located at a 1.8-cm depth. The first slice is the spatial x-y image of 8×8 cm obtained at a 0.3-cm depth, and the fourth cross-section slice is at a 1.8-cm depth. (a), (c), and (e) Reconstructed absorption maps obtained at 780 nm using fitted background values and a semi-infinite model for the layered structure. Reconstructed target maximum absorption coefficients were 0.158, 0.169, and 0.191 cm-1, respectively. (b), (e), and (f) Reconstructed absorption maps obtained at the same wavelength using the two-layer model with fitted background values. The reconstructed target maximum absorption coefficients were 0.201, 0.206, 0.198 cm-1, respectively.

