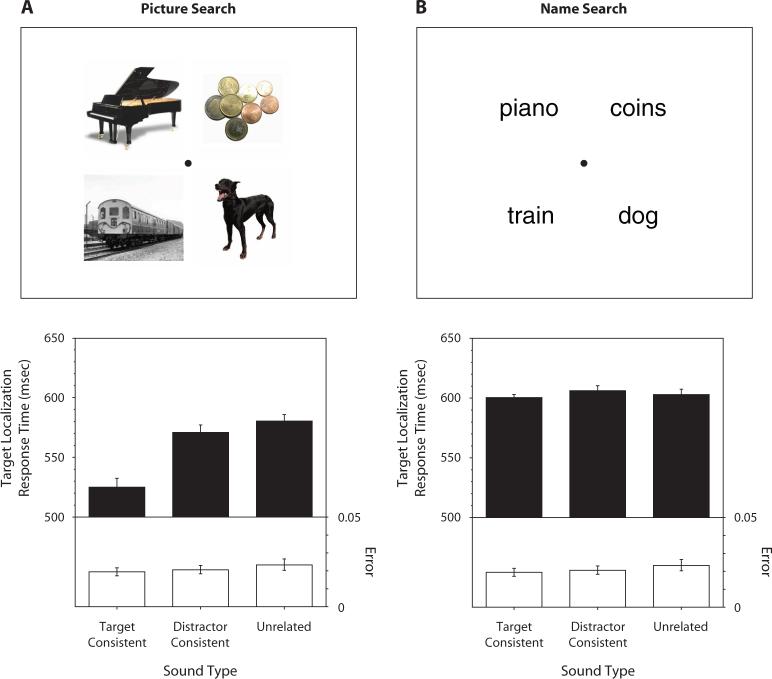
Figure 1.
Effects of characteristic sounds on four-item visual search. (A) The upper panel shows an example of a picture-search display. The lower panel shows target localization response times (RTs; filled bars) and error rates (open bars) when the search displays were presented with the target-consistent sounds, distractor-consistent sounds, or unrelated sounds. The error bars represent ±1 SE (the variance due to differences in the overall RT or error rate among the participants was removed before computing SE). (B) The corresponding information for the name-search experiment.

