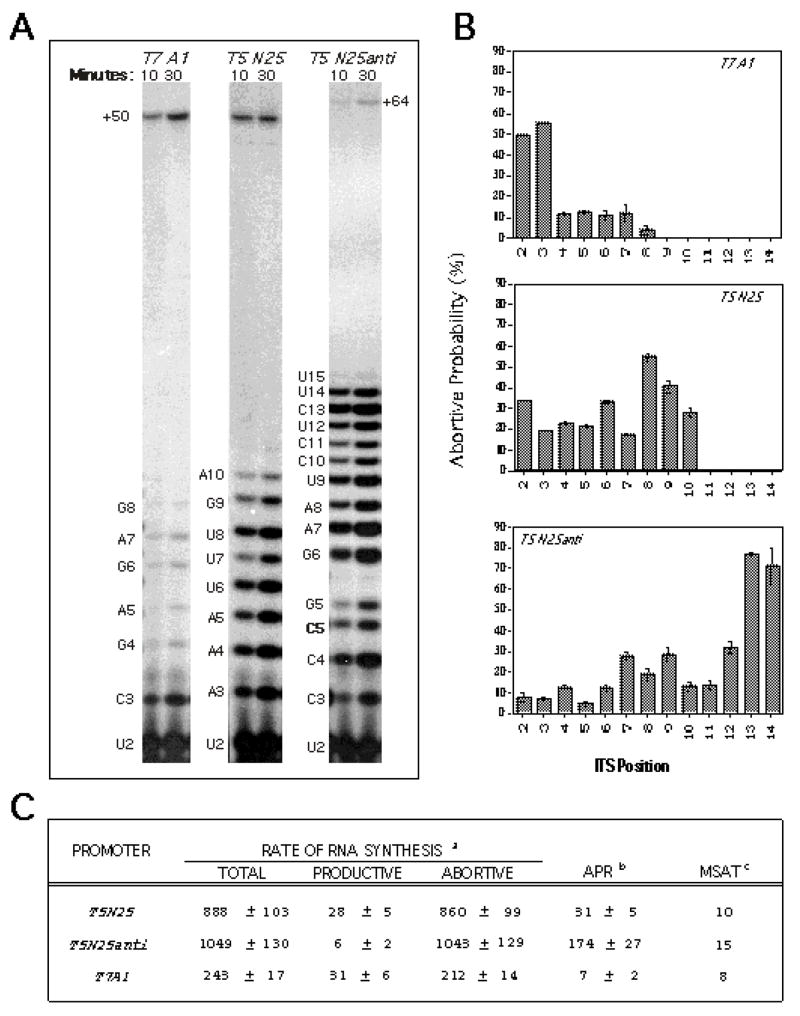
Figure 1.
A typical result of the quantitative and qualitative analysis of transcription. The figure shown is taken from Ref. 8 where three phage promoters –T7 A1, T5 N25, and N25anti -- were analyzed. A. A time-course investigation involving two time points (10-minute and 30-minute) was performed to obtain the abortive and productive rates. B. Abortive probability was calculated as described [7]. Plotting the abortive probability of an initial transcribing complex to its abortive product length yields the abortive probability profile, which shows up the location of high abortive barriers on each promoter. Abortive probability profiles for all three promoters are displayed. C. Tabulation of the various quantitative parameters. aProductive and abortive rates measured as (femto)moles of RNA per (femto)mole of RNA polymerase per hour. bAPR: the abortive:productive ratio. cMSAT: the maximal size of abortive transcript.

