
FIGURE 6. TNF increases Smurf1 expression in vivo.
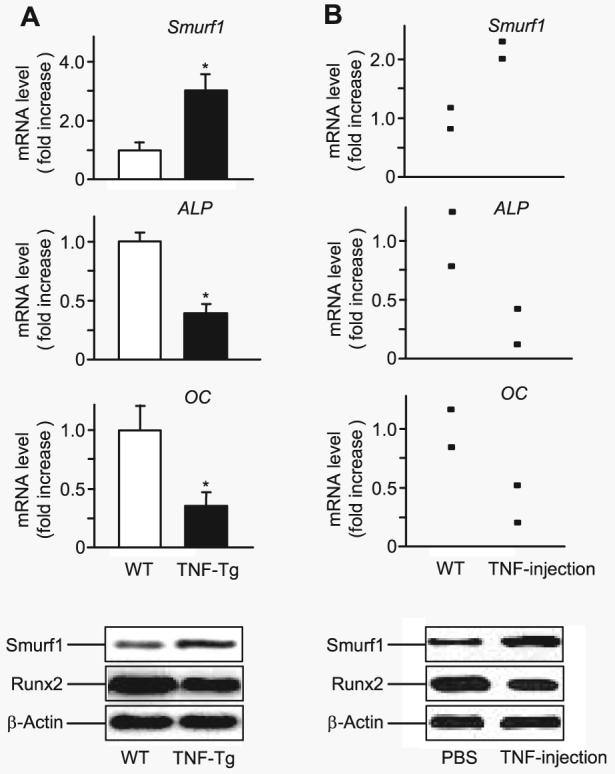
A, RNA and protein were extracted directly from the metaphyseal region of 4-month-old TNF-Tg mice and wt littermates. The relative expression levels of Smurf1, ALP, and OC were measured by real time RT-PCR (upper panels), as described in Fig. 2. The values are the mean ± S.E. of four pairs of TNF-Tg and wt mice. *, p < 0.05 versus wt mice. Smurf1 and β-actin protein levels were determined by Western blot analysis (lower panels). The data are representative of three pairs of TNF-Tg or wt mice. B, TNF (0.25 μg/injection, three times/day × 3 days, n = 2) or PBS was injected over the calvarial bones of wt mice. RNA and protein were extracted directly from calvarial bones. Expression levels of Smurf1, ALP, and OC mRNA and Smurf1 and β-actin protein were examined as described in A. The data show the values of individual mice.