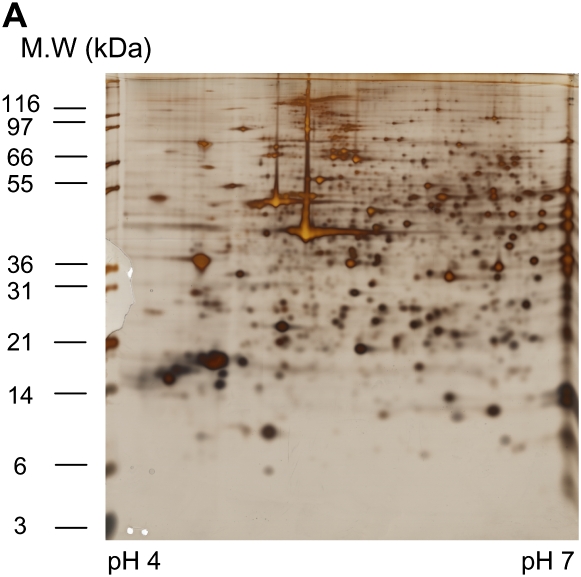
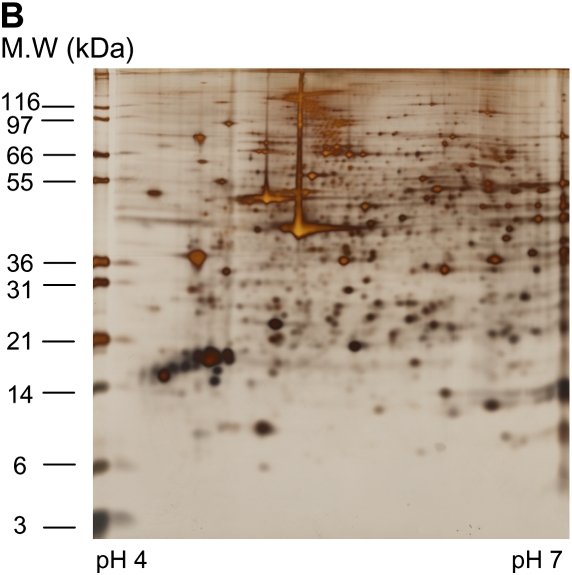
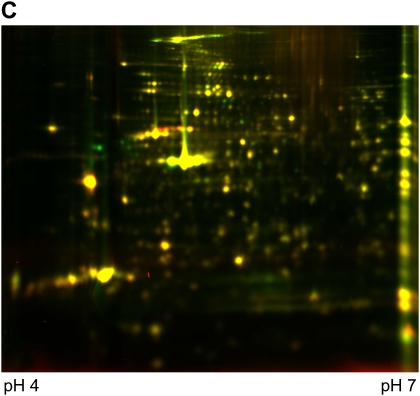
Figure 2.
An example of two samples stained with silver (A and B) for comparison or analyzed using 2D DIGE (C). (A) Sino-atrial node cells without treatment (control); 150 μg was loaded onto 18 cm 10% Bis-Tris gels, silver stained. (B) Sino-atrial node cells treated with protein kinase inhibitor for 5 min; 150 μg was loaded onto 18 cm 10% Bis-Tris gels, silver stained. (C) 2D DIGE image with control labeled with Cy3 (green) and protein kinase inhibitor treated sample labeled with Cy5 (red).


