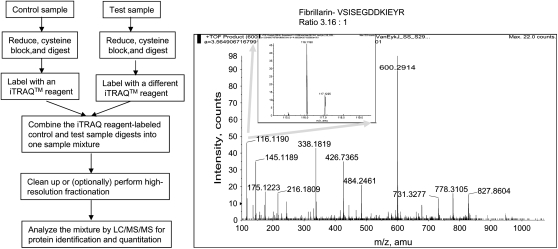
Figure 4.
Overview of iTRAQ reagents methodology. The left schematic diagram shows the flow of iTRAQ methodology, and the spectra on the right shows an example MS/MS spectrum. The control was labeled with 116.1 and the test sample was labeled with 117.1 with a ratio of 3.16:1 as shown in the insert on the right. This peptide VSISEGDDKIEYR is from fibrillarin. The MS/MS spectrum is used courtesy of Shijun Sheng, Johns Hopkins University.

