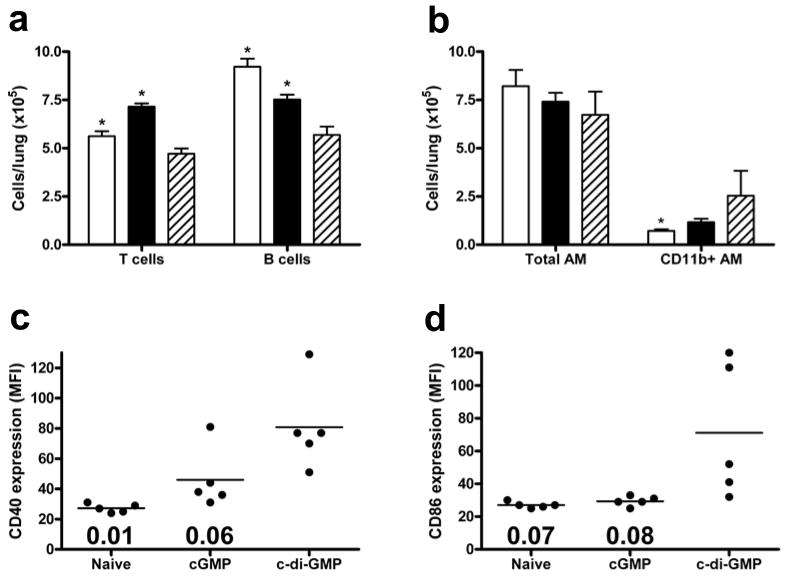
Fig. 5.
Effect of c-di-GMP treatment on lung cells. Lung cell populations were quantified (a, b) in naïve mice (open bars), or following cGMP (closed bars) or c-di-GMP treatment (hatched bars). Graphs show mean numbers of CD3+TCRb+CD19− T cells, CD3−TCRb−CD19+ B cells (a), and CD11c+MHCIIlowCD11b+/− AM (b). *P<0.05 compared with c-di-GMP group (Student’s t-test). Expression of CD40 (c) and CD86 (d) on CD11c+MHCIIhigh lung dendritic cells is shown for individual mice in each group as mean fluorescence intensity (MFI). Bars represent mean values and numbers indicate P value compared with c-di-GMP group.

