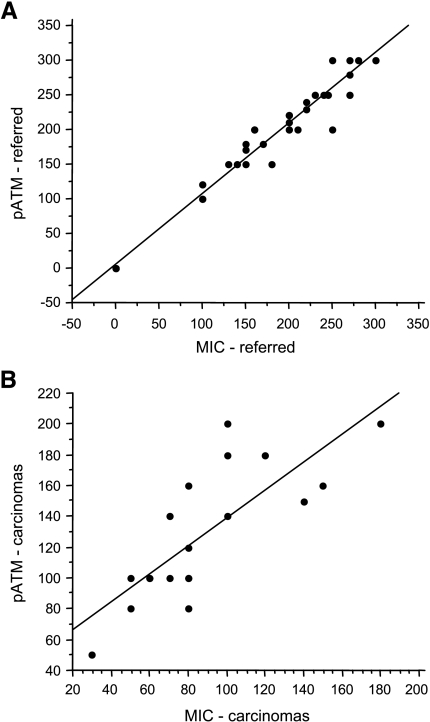
Figure 4.
Correlation of MIC expression with ATM phosphorylation. (A) Significant correlation of ATM phosphorylation and MIC expression in the prostate epithelium of the “referred” men, R = 0.99, P < .001. (B) A lesser degree but still significant correlation of ATM phosphorylation and MIC expression in the prostate carcinomas, R = 0.78, P < .001. ATM phosphorylation and MIC immunostaining were evaluated using a semiquantitative composite score method as described in the Materials and Methods section. Data were analyzed using Pearson's correlation test.

