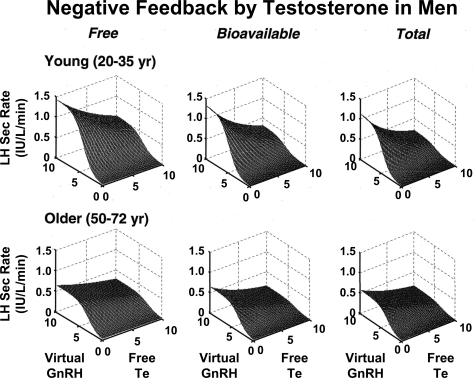
Figure 14.
Analytical estimation of age cohort-defined three-dimensional surfaces relating LH secretion (vertical axis) to estimated GnRH outflow (oblique axis) and free Te (left), bioavailable Te (middle), and total Te (right) concentrations (horizontal axes). Data are from 10 young and 8 older men. [Reproduced with permission from D. M. Keenan et al.: Endocrinology 147:2817–2828, 2006 (17).]

