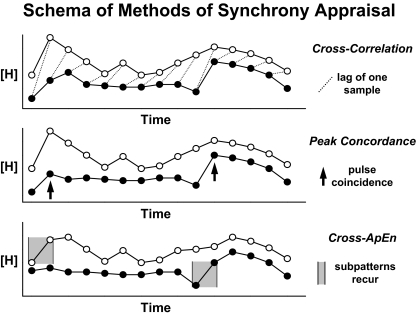
Figure 16.
Schematic representation of three methods to quantify pairwise synchrony of hormone time series. The techniques give complementary insights into coordinate control. In particular, cross-correlation is linear and lag-specific (top); discrete peak coincidence is probabilistic and lag-specific (middle); and cross-ApEn is a scale-, model-, and lag-free joint synchrony measure (bottom).

