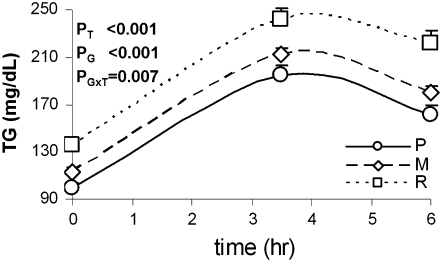
FIGURE 2.
Postprandial triacylglycerol (TG) response in the GOLDN (Genetics of Lipid Lowering Drugs and Diet Network) study participants who underwent the oral fat-load test, according to the 3 GCKR-APOA5 combined genotype groups. P, homozygous subjects for the wild-type alleles for each single nucleotide polymorphism (SNP; CC rs780094 at the GCKR gene and TT −1131T→C APOA5 + CC 56C→G APOA5), n = 281; M, any mixed genotype not included in groups P and R, n = 583; and R, carriers of the variant allele for the GCKR rs780094 (CT or TT) and carriers of the variant alleles at one of the APOA5 SNPs (TC or CC at −1131T→C or CG or GG at 56C→G), n = 141. Adjusted TG means (for sex, age, and BMI) and SEMs, immediately before (time 0) and 3.5 and 6 h after the high-fat meal are compared. Adjusted P values for the effect of the genotype (PG), the time (PT), and the interaction of genotype and time (PGxT) obtained in the statistical model for repeated measures are shown.

