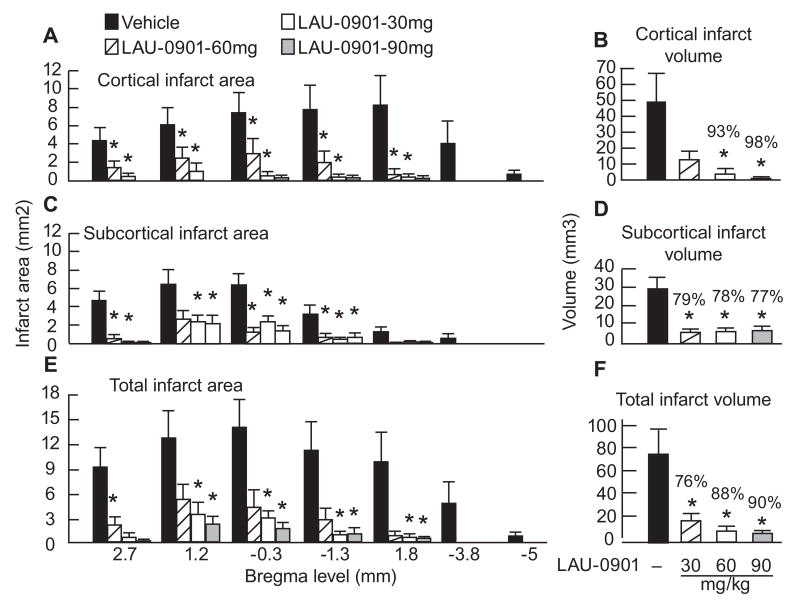
Figure 4.
Cortical, subcortical and total infarct areas measured at 7 coronal levels and integrated infarct volumes in rats with 2-h MCAo and on day 7 of survival. Rostrocaudal distribution of cortical infarct area and cortical infarct volume (Panels A and B), subcortical infarct area and subcortical infarct volume (Panels C and D) and total infarct area and total corrected infarct volume (Panels E and F) in all groups. Data are presented as mean ± SEM. *Significantly different from corresponding vehicle group (p <0.05).

