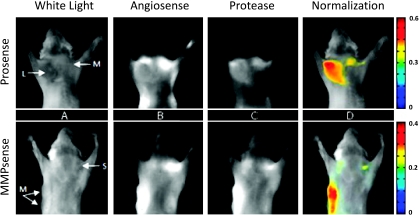
Figure 3.
In vivo dual-wavelength epi-illumination images of cysteine protease expression in transgenic mammary tumor-forming mice. (A) White light image identifies tumor location and category: S indicates small, M, medium, L, large tumors. (B) AngioSense channel shows an accumulation of probe in tumor and represents vascularization and biodistribution of activatable probe. (C) Protease channel (either ProSense or MMPSense) shows accumulation of probe in tumor, but tumor size is not ascertainable by expression levels. (D) Superposition of protease signal divided by AngioSense signal with white light image shows how dual-wavelength/normalization approach can improve the observation accuracy.

