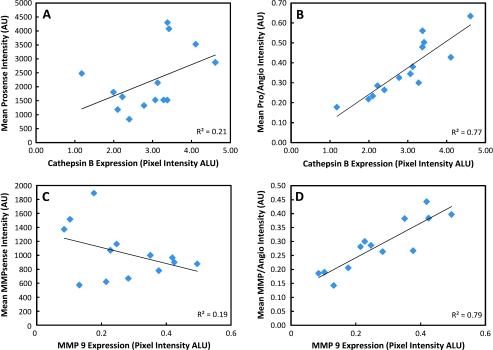
Figure 5.
In vivo fluorescence signals plotted against ex vivo signals obtained by Western blot analyses. Mean ProSense (A) and MMPSense (C) signals plotted against corresponding total protein level expressions. Mean ProSense (B) and MMPSense (D) normalized to drug delivery (i.e., divided by AngioSense) plotted against corresponding total protein level expressions. Normalizing in vivo protease signals with biodistribution signals allows for an internal correction that also provides an improved correlation to the underlying physiology.

