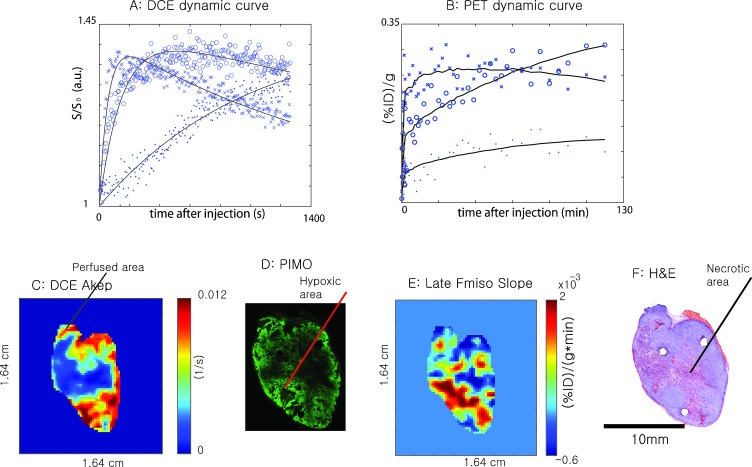
Figure 4.
Characteristic dynamic uptake curves of Gd-DTPA-assisted DCE-MRI (A) and 18F-Fmiso PET (B) for different tumor microenvironments (x, perfused area; ○, hypoxic area; ●, necrotic area). Perfused, necrotic, and hypoxic areas were independently selected from DCE-MRI (C), H&E (F), pimonidazole (D) and late Fmiso slope (E) images, respectively, and corresponding dynamic curves are plotted in A and B.

