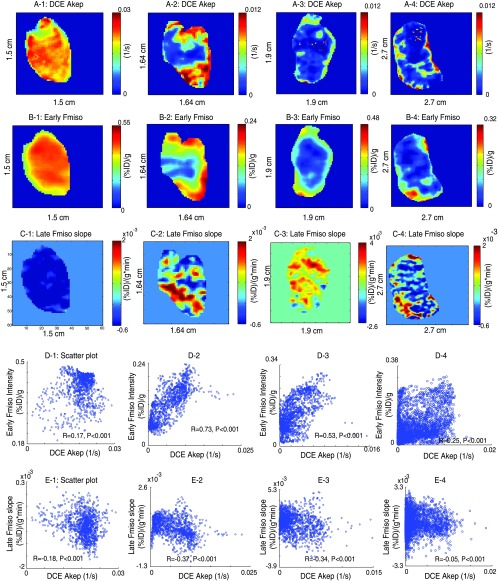
Figure 6.
The rows of A, B, and C show DCE-Akep map, early (5 minutes) 18F-Fmiso uptake values, and slope map of later 18F-Fmiso curve for a slice from four different animals (numbered 1 to 4), respectively. The rows of D and E plot voxel-by-voxel scatterplots for the direct comparison of these quantities. The tumor sizes are 478 mm3 (1), 744 mm3 (2), 870 mm3 (3), and 2531 mm3 (4).

