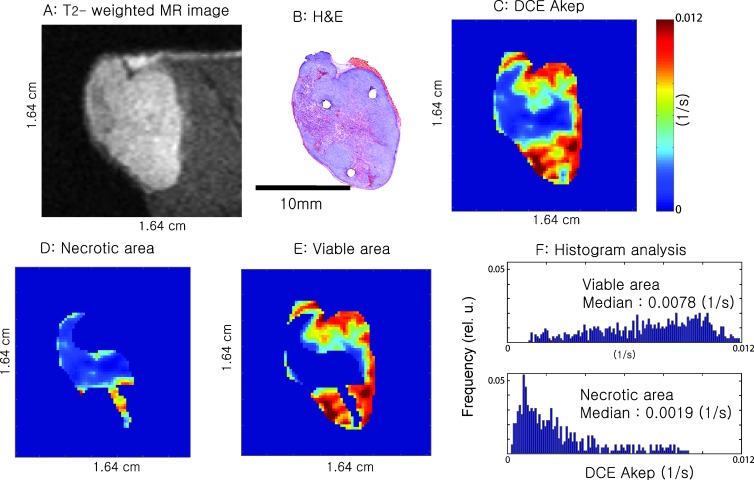
Figure 7.
T2-weighted MR image of a slice from one animal (A), corresponding H&E-stained tissue section (B), and corresponding DCE Akep map (C). D and E are the masked Akep values for the necrotic and viable tumor areas, respectively. The histograms in (F) plot the Akep values for viable and necrotic tumor areas, respectively. The median Akep values for viable tumor regions were significantly higher (P < .001) than those of necrotic regions. The tumor size was 744 mm3.

