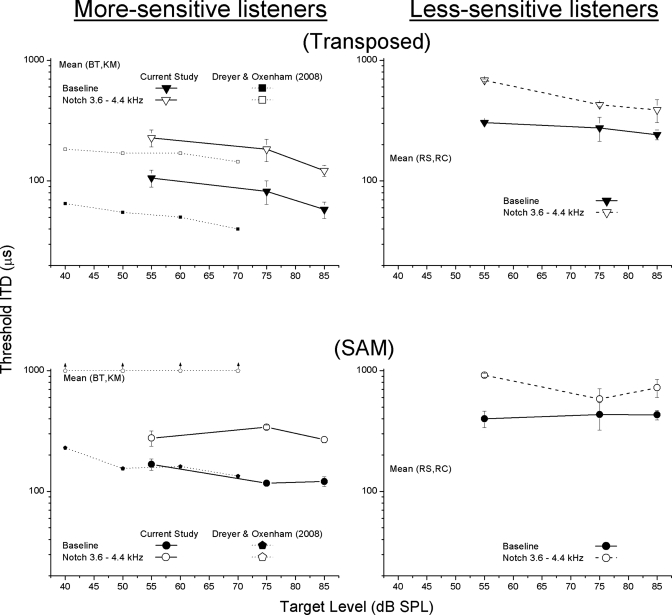
Figure 1.
Threshold ITDs measured as a function of the overall level of the target. Left and right panels depict average threshold ITDs obtained from the two more-sensitive and the two less-sensitive listeners, respectively. Panels in the top and bottom rows depict data obtained with the 4-kHz-centered transposed and SAM targets, respectively. The rate of modulation was 128 Hz. Closed symbols represent the data obtained in the baseline condition; open symbols represent the data obtained when the targets were surrounded by a 3.6–4.4 kHz notched noise. The error bars represent ±1 standard error of the mean. The small squares in the left panel represent average threshold ITDs transcribed from Dreyer and Oxenham (2008).

