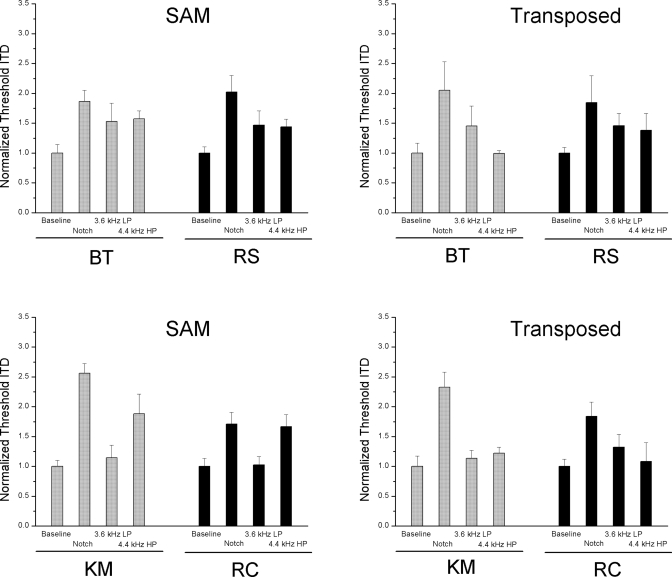
Figure 2.
Each row displays data obtained from a pair of listeners (BT∕RS or KM∕RC). The bars within each plot represent, for each listener, threshold ITDs normalized against the mean threshold ITD obtained in the respective SAM (left-hand panels) or transposed (right-hand panels) target baseline conditions. The data were collapsed across all three levels of presentation of the targets (55, 75, and 85 dB SPL). Error bars represent one standard error of the mean.

