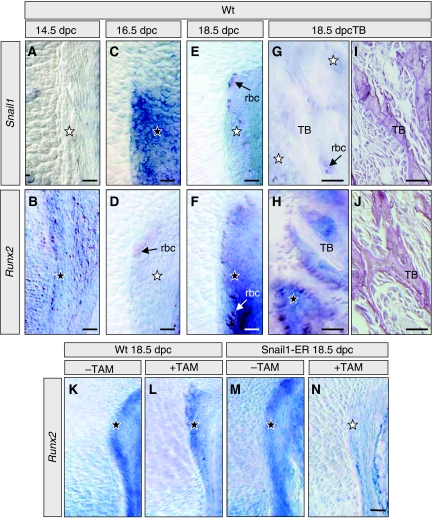
Figure 7.
Snail1 activation represses Runx2 expression in vivo. (A–J) Snail1 and Runx2 show excluding expression patterns during osteoblast differentiation in vivo in wild-type mice. (A, B) At 14.5 dpc, only Runx2 is expressed in the perichondrium and in the periosteum (not shown). (C, D) Snail1 is expressed in the perichondrium at 16.5 dpc while Runx2 transcripts are absent. (E, F) At 18.5 dpc, Snail1 expression has decreased in the perichondrium, whereas that of Runx2 has significantly increased. (G, J) At the same stage, Runx2 is expressed in the osteoblasts surrounding the trabecular bone (TB) in the absence of Snail1 transcripts. (K–N) Snail1 activation by tamoxifen administration inhibits Runx2 expression in the perichondrium of Snail1-ER transgenic mice. Black and white stars indicate high and low expression levels, respectively. Arrows point to unspecific signal observed in red blood cells (rbc). Black stars indicate endogenous Runx2 expression, and white star indicate repression of endogenous Runx2 expression by Snail1 activation.

