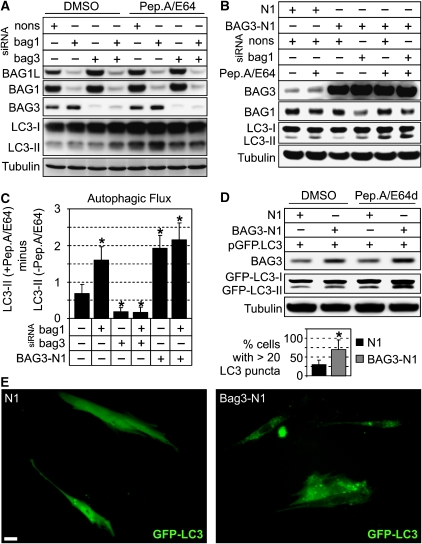
Figure 3.
(A) 293 cells were transfected with nonsense (nons), bag1 or bag3 siRNAs for 48 h and then treated for 2 h with the lysosomal inhibitors pepstatinA and E64 (both 10 μg/ml; Pep.A/E64) or DMSO as control, followed by immunoblot analysis of the indicated proteins. (B) 293 cells were transfected for 48 h with the indicated siRNAs and BAG3 expression plasmid (BAG3-N1) or vector control (N1) followed by the same analysis as in (A). (C) Diagram shows the autophagic flux of 293 cells with differently modulated BAG1 and BAG3 levels as described in (A) and (B). Autophagic flux was determined by the strength of LC3-II accumulation in a 2-h treatment period with Pep.A/E64. Therefore, normalised LC3-II levels in the absence of inhibitors were subtracted from corresponding levels obtained in the presence of Pep.A/E64. Values are expressed as mean±s.e.m. *P<0.05 versus control-transfected cells, n=3. (D) I90 cells were transfected with GFP fused to LC3 (pGFP.LC3) and co-transfected either with BAG3-N1 or N1. After transfection for 48 h, cells were treated as in (A) and levels of indicated proteins were detected by immunoblot analysis. (E) I90 cells, transfected as in (D) for 24 h, were microscopically analysed for GFP-LC3 fluorescence. Representative pictures are shown. Bar: 20 μm. Values expressed in diagram are mean±s.e.m. from three independent experiments (50 cells were counted per experiment). *P<0.05 versus N1, n=3.

