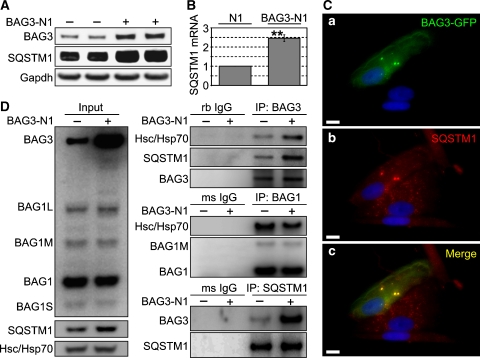
Figure 4.
(A) I90 cells were transfected with BAG3 (BAG3-N1) or vector control. After transfection for 48 h, levels of indicated proteins were detected by western-blot analysis. (B) Transcript levels of SQSTM1 in I90 cells transfected as in (A) were compared by real-time PCR analysis. Depicted is the fold-increase of SQSTM1 mRNA levels in BAG3-N1-transfected cells relative to control (N1)-transfected cells. Values are expressed as mean±s.e.m. **P<0.01 versus N1 cells, n=3. (C) I90 cells were transfected with a BAG3-GFP fusion plasmid for 48 h followed by indirect immunofluorescence staining of endogenous SQSTM1. (a) Direct fluorescence of BAG3-GFP (green), (b) indirect immunofluorescence of SQSTM1 (red) and (c) the stainings of (a) and (b) overlapped. DAPI (blue) was used to stain DNA. Representative pictures are shown. Bar: 10 μm. (D) Co-IP studies testing the interaction of SQSTM1 and BAG3. I90 cells were transfected as in (A). After 24 h, SQSTM1 and BAG3 were immunoprecipitated followed by analysis of co-sedimented proteins, as indicated. As negative control purified rabbit (rb) and mouse (ms) IgG was used. Left panel shows relative amounts of proteins in lysates used for Co-IP (Input).

