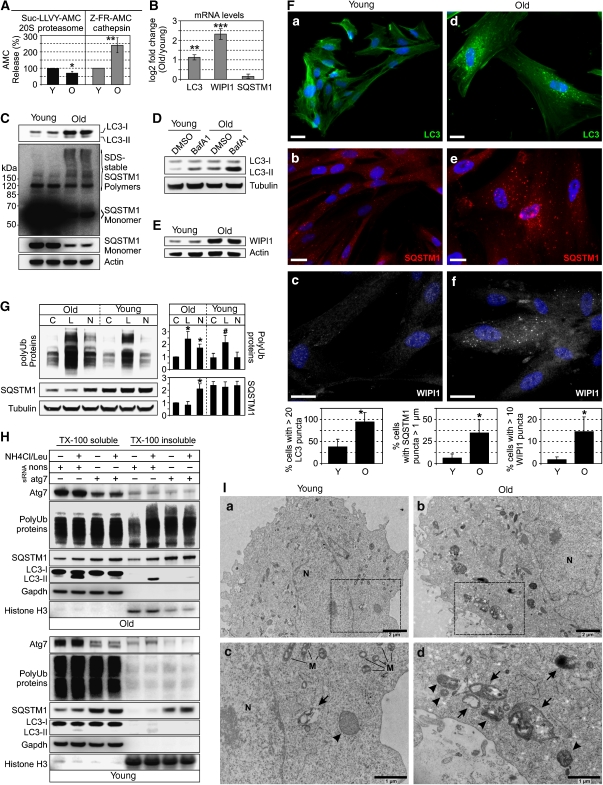
Figure 5.
(A) Proteasomal chymotrypsin and cathepsin activity in lysates from young (Y) and old (O) I90 cells was determined using specific fluorescence probes, as described in the Material and methods section. Values are expressed are mean±s.e.m. *P<0.05 and **P<0.01 versus young, n=3. (B) Real-time PCR analysis of LC3, WIPI1 and SQSTM1 mRNA levels in young and old I90 cells. Depicted is the mean expression ratio (log2) ±s.e.m. of target genes in old cells relative to young cells. **P<0.01 and ***P<0.001 versus young, n=3. (C) Immunoblot analysis of LC3 and SQSTM1 in young and old I90 cells. (D) Young and old I90 cells were treated for 2 h with bafilomycin A1 (BafA1, 2 μM) or DMSO as control followed by immunoblot analysis of indicated proteins. (E) Immunoblot analysis of WIPI1 expression in young and old I90 cells. (F) Indirect immunofluorescence staining of endogenous LC3 (green), SQSTM1 (red) and WIPI1 (white) in I90 cells of young and old age. DAPI (blue) was used to stain DNA. Representative pictures are shown. Bar: 20 μm. Diagrams show percentage of cells with indicated characteristics counted as in Figure 3E. (G) Old and young I90 cells were treated for 1 h with DMSO as control (C), lactacystin (L, 2 μM) or NH4Cl (20 mM) plus leupeptin (Leu, 5 μM) (N, NH4Cl/Leu). Western-blot analyses were performed for detection of indicated proteins. In the diagram (right panel), levels of polyUb-proteins and SQSTM1 are depicted after normalisation to corresponding Tubulin levels. Values are expressed as mean±s.e.m. *P<0.05 versus old control, #P<0.05 versus young control, n=3. (H) I90 cells of old (upper panel) and young (lower panel) age were transfected with atg7 or nonsense (nons) siRNA. After transfection for 4 days , the cells were treated with NH4Cl/Leu or DMSO for 1 h followed by fractioning of cell lysates in TritonX-100 (TX-100) soluble and insoluble material. Equal protein amounts of both fractions were directed to immunoblot analysis for analysis of indicated proteins. Gapdh and Histone H3 were used as loading controls of soluble and insoluble fractions, respectively. (I) Transmission electron microscopic analysis of young (a) and old (b) I90 cells. Magnifications of marked areas in (a) and (b) are shown in (c) and (d), respectively. An arrow indicates an autolysosome, and arrow heads indicate autophagosomes. M, mitochondrion. N, nucleus.

