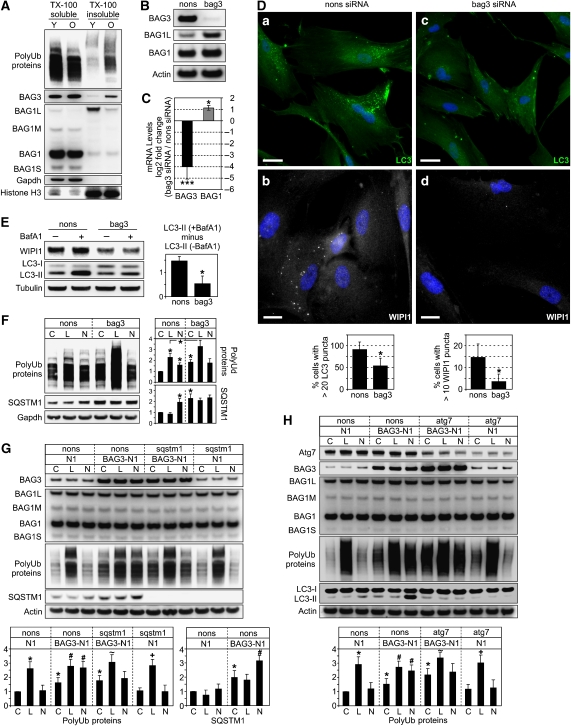
Figure 6.
(A) Immunoblot analysis of indicated proteins of young (Y) and old (O) I90 cells upon fractionation as described in Figure 5H. (B, C) After transfection for 96 h of old I90 cells with bag3 or nonsense (nons) siRNA, BAG1 and BAG3 protein and mRNA levels were analysed by immunoblot (B) and real-time PCR (C) analysis, respectively. Transcript levels in bag3 siRNA cells are depicted as the mean log2 expression ratio ±s.e.m. relative to nons siRNA cells. *P<0.05 and ***P<0.001 versus nons, n=3. (D) Indirect immunofluorescence analysis of endogenous LC3 (green) and WIPI1 (white) in old I90 cells transfected with nons (a, b) and bag3 siRNA (c, d) for 96 h. DAPI (blue) was used as a nuclear marker. Representative pictures are shown. Bar: 20 μm. Diagrams show percentage of cells counted as in Figure 3E. (E) Same analysis as in Figure 5D but old cells transfected as in (A) were used. Values expressed in the diagram are mean±s.e.m. *P<0.05 versus nons, n=3. (F) Same analysis as in Figure 5G but old I90 cells transfected as in (A) were used. C, control; L, lactacystin, N, NH4Cl/Leu. Values are expressed as mean±s.e.m. *P<0.05 versus nons control, or as indicated, n=3. (G, H) Same analysis as in (F) but young I90 cells 48 h after transfection with a BAG3 expression plasmid (BAG3-N1) or vector control (N1) together with nons or sqstm1 siRNA (G) and nons or atg7 siRNA (H), as indicated, were used. *, #, ∼ and +, P<0.05 versus C N1, C BAG3-N1, C BAG3-N1 sqstm1 or atg7 and C N1 sqstm1 or atg7, n=3.

