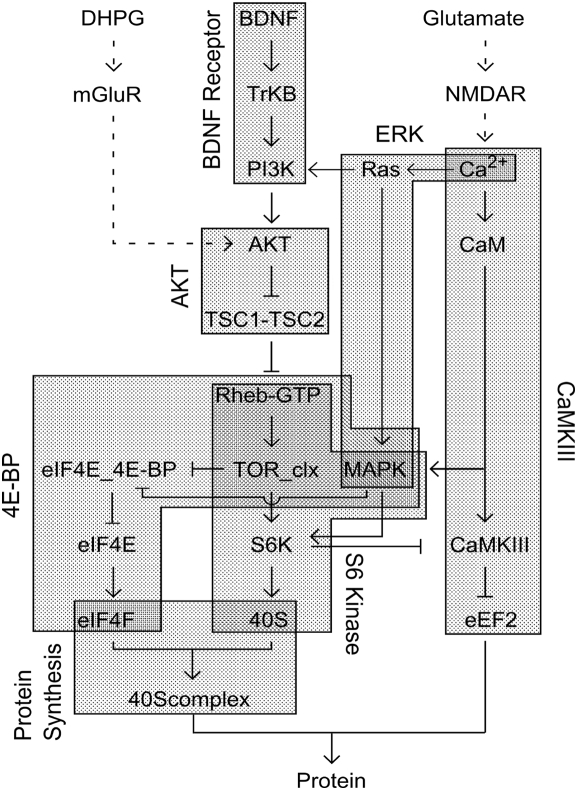
Figure 1. Block diagram of signaling network.
Inputs are located at the top. The primary input to the pathway is BDNF. We use Ca2+ influx as a surrogate for glutamate input, and AKT activation as equivalent to input from the mGluR5 pathway, since it is still incompletely understood. Dashed arrows represent such virtual inputs. Regular arrows represent positive interactions and T-s represent inhibitory inputs. The various modules in the model are represented as gray blocks, and their names are in rotated text.

