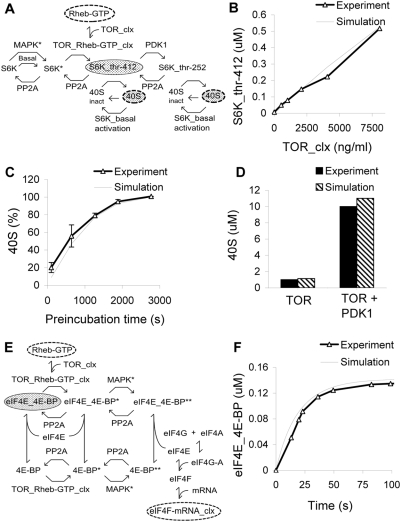
Figure 3. TOR signaling.
(A) Chemical reaction diagram of S6K regulation culminating in 40S phosphorylation. (B) S6K phosphorylation as a function of TOR levels [44]. (C) 40S phosphorylation as a function of preincubation time of TOR and S6K (0.5, 10, 20, 30, and 45 min) [37]. (D) 40S phosphorylation is stimulated 10 fold by PDK1 [37]. (E) Chemical reaction diagram of eIF4E regulation, culminating in formation of the eIF4F-mRNA complex. (F) Time-course of eIF4E-BP complex formation [47].

