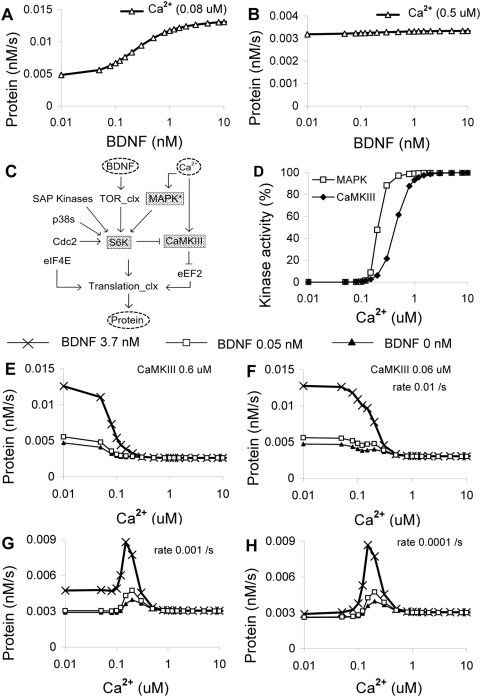
Figure 7. Steady-state responses to BDNF and Ca2+.
(A,B) Protein synthesis rate as a function of BDNF level, at 0.08 and 0.5 µM Ca2+ respectively. (C) Simplified block diagram, indicating manipulated molecules in gray. (D) Comparison of activation curves for MAPK (phosphorylated form) and CaMKIII (CaM-Ca4 bound form) response to Ca2+. (E,F) Protein synthesis rates as a function of Ca2+, at two different levels of CaMKIII (0.6 µM (E), 0.06 µM (F)), both with a S6K phosphorylation rate of 0.01. There is a modest shift in Ca2+ dependence for the 3.7 nM BDNF case. (G,H) Reduced basal phosphorylation of S6K from 0.01 to 0.001 (G) or 0.0001 (H) converts the Ca2+ responses to a narrow bell-curve gated by BDNF.

