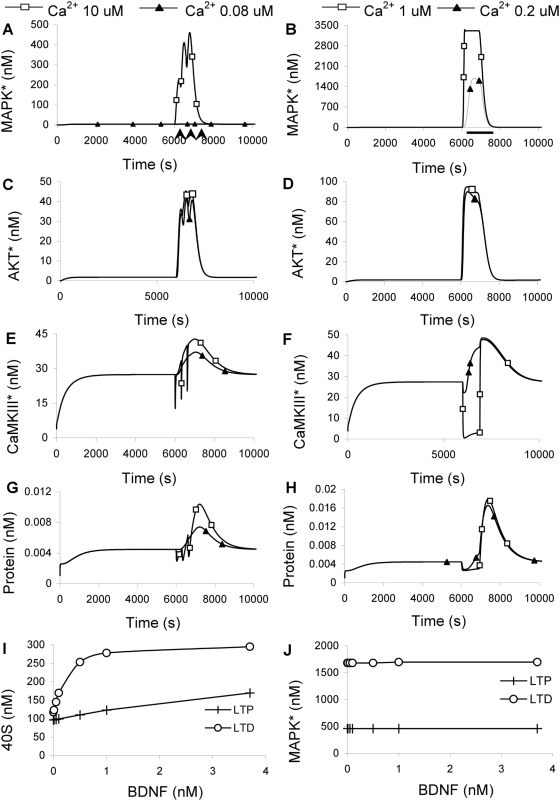
Figure 8. Responses to LTP and LTD stimuli.
In (A–F) the LTP responses are on the left and LTD on the right. LTP stimulus was 3 Ca2+ peaks of 10 µM for 1 sec each, separated by 5 min, accompanied by BDNF input at 3.7 nM for 5 sec each (Arrows below time axis in (A)). Filled triangles indicate runs where the Ca2+ remained at baseline (0.08 µM) and only the BDNF stimulus was given. The LTD stimulus (Bar below time axis in (B)) was a single pulse of Ca2+ for 900 sec at 1 µM (open squares) and 0.2 µM Ca2+ (filled triangles). BDNF was a single 900 sec pulse at 3.7 nM. (A,B) MAPK activation. (C,D) AKT activation. (E,F) CaMKIII activation. (G,H) Protein synthesis. (I) Peak 40S as a function of BDNF levels for the LTD and LTP stimuli, at 0.2 and 10 µM Ca2+, respectively. The LTD stimulus gives nearly twice the 40S levels except at very low BDNF. (J) Peak MAPK activation by LTD and LTP stimuli, at 0.2 and 10 µM Ca2+, respectively. MAPK responds more strongly to the LTD stimulus, and is not sensitive to BDNF levels.

