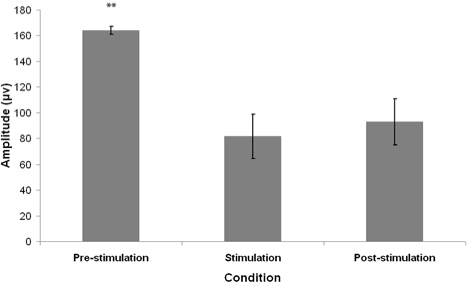
Figure 3.
Mean amplitude of eye movements 1 min preceding tone presentation (pre-stimulation), during 1 min tone presentation (stimulation) and 1 min following tone presentation (post-stimulation). Error bars denote standard error of the mean. **P < 0.01- Wilcoxon signed rank test comparison to the stimulation condition.

