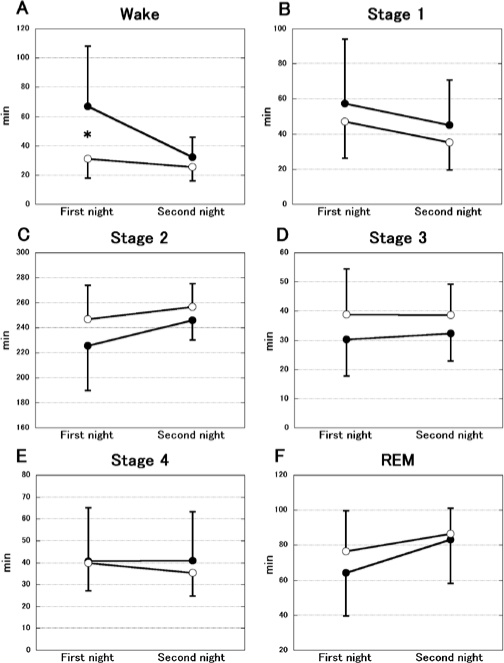
Figure 5.
The change of sleep structure during 2 consecutive nights in the FG (open circles; n = 8) and placebo groups (filled circles; n = 8). The data represent the mean ± SD. A significant decrease in wake state (incorporating both wake after sleep onset and latency to fall asleep) was shown on the first night in the FG group (A). Other states (Stage 1–4, REM) did not change (B–F). The amounts were estimated by total time. *P < 0.05.

