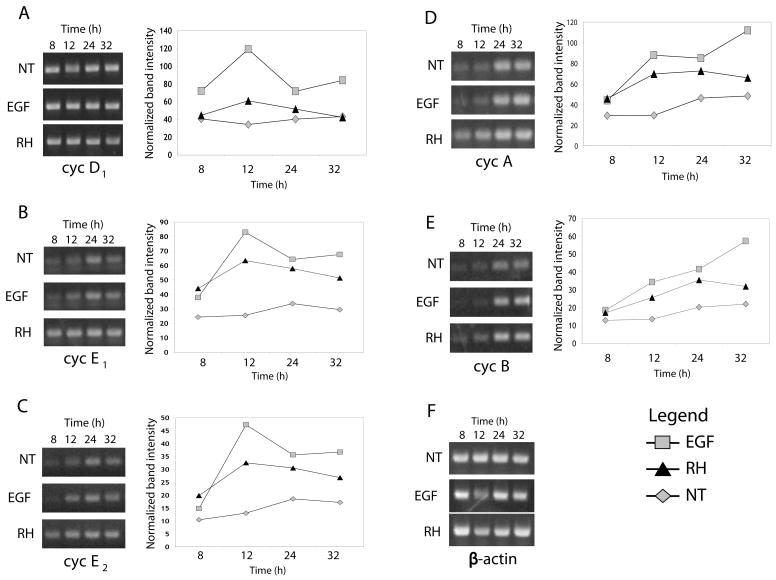
Fig 3.
RT-PCR analysis of cyclin expression in response to EGF or T. gondii infection. HFF were left untreated (NT), stimulated with EGF (20ng/ml), or infected with T. gondii RH at an m.o.i. of 5:1. RNA was isolated after 8, 12, 24, and 32 hours of incubation. RT-PCR amplification and analysis of gene expression of cyclin D1 (A), cyclin E1 (B), cyclin E2 (C), cyclin A (D), cyclin B (E), and β-actin (F) were performed as described in Experimental Procedures. Gel images and corresponding densitometric profiles are shown from a representative experiment of three performed. Increased steady state message levels are observed following infection and EGF treatment consistent with cell cycle entry.

