
Figure 2.
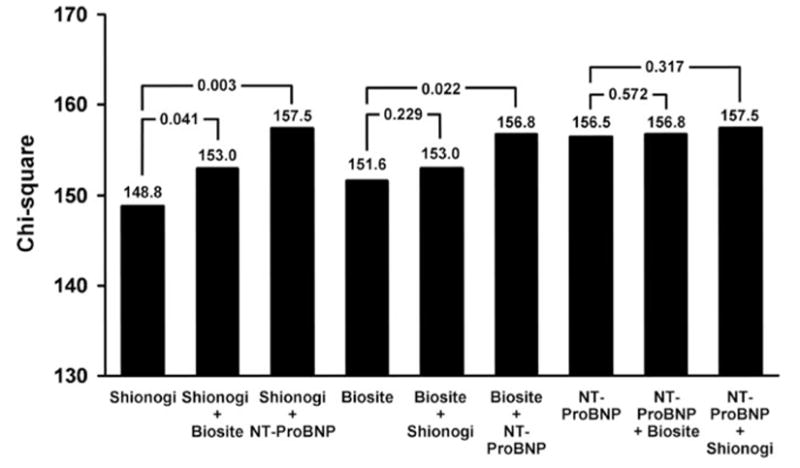
Age- and gender-adjusted sequential modeling to determine the incremental value of each assay over the remaining 2 assays as a predictor of mortality. For a particular assay, the change in overall model fit (log likelihood statistic) relative to the addition of 1 or both of the remaining assays was calculated to determine whether there was incremental value in performing an additional assay. P values represent the statistical significance of the difference between models.