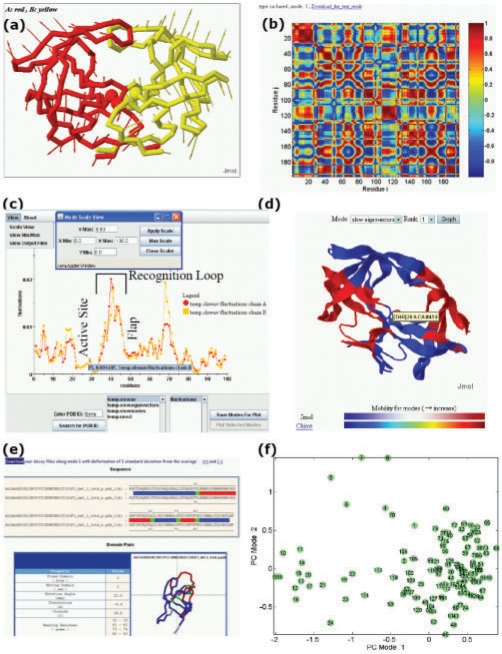
Fig. 3.
PCA_NEST outputs and interfaces, illustrated for HIV-1 protease (PDB code: 1bve). (a) Conformational changes along the first PC mode. The diagram represents a snapshot from a JMol animation describing the conformational fluctuations favored by this particular mode. The arrows refer to the elements of the first eigenvector v(1); they describe the directions of the movements of each CG-node, and their lengths are proportional to the magnitude of the fluctuations. Active sites Asp25 and Thr26 are shown in spheres. (b) Residue–residue correlation map for the first PC mode (see Supplementary Material for details) (c) M12,i profiles [see Equation (8)] for monomers A and B of HIV-1 protease. The minima in the profile are further analyzed (with regard to the solvent exposure and spatial clustering of the corresponding residues) to identify PFSs. (d) Ribbon diagram illustrating the PCA_NEST-defined dynamic domains. Different colors indicate substructures subject to opposite direction (anticorrelated) movements in the first PC mode. We note that active sites are located near the interface between the dynamic domains in the center of the molecule. (e) Decoys along the PC mode 1. Decoys are created in pairs (along the positive and negative directions of the first PC), and they are automatically submitted to DynDom (Hayward and Berendsen, 1998) for dynamic domain analysis. (f) Distribution of the 128 NMR frames deposited for ubiquitin (1xqq) on the conformational subspace spanned by PC modes 1 and 2. Such projection onto a reduced space allows for clustering structures based on their dominant conformational features.

