
Table 1.
Identification of the PC and ANM modes that dominate experimentally observed conformational changesa
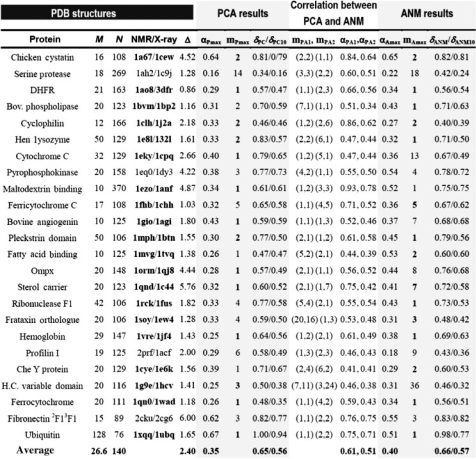 |
aPDB codes for 24 pairs of homologous NMR and X-ray structures are listed in the column ‘NMR/X-ray’. M and N are the available number of NMR models and the number of residues for a given protein respectively. Δ is the RMSD (Å) between the average NMR structure and the corresponding X-ray structure. The mPmax is the index of the PC mode that shows maximal correlation with Δ{Φ}, and αP,max is the corresponding correlation (Equation 7 with k=mPmax). δPC is the cumulative contribution of all PC modes, δPC=(∑αP,i2)1/2(1≤i≤M). The δPC10 is the counterpart of δPC based on the first 10 modes (1≤i≤10). The mAmax is the index of the ANM mode that shows the highest correlation with Δ{Φ}. The corresponding correlation is αA,max. Bold-faced mpmax/mAmax values correspond to the 20 cases where robust modes describe most of observed conformational changes (see main text). δANM is the ANM counterpart of δPC. The highest and second highest correlations observed between pairs of PC- and ANM-modes are αPA1 and αPA2 respectively. The corresponding pairs of mode numbers are mPA1 and mPA2, respectively.