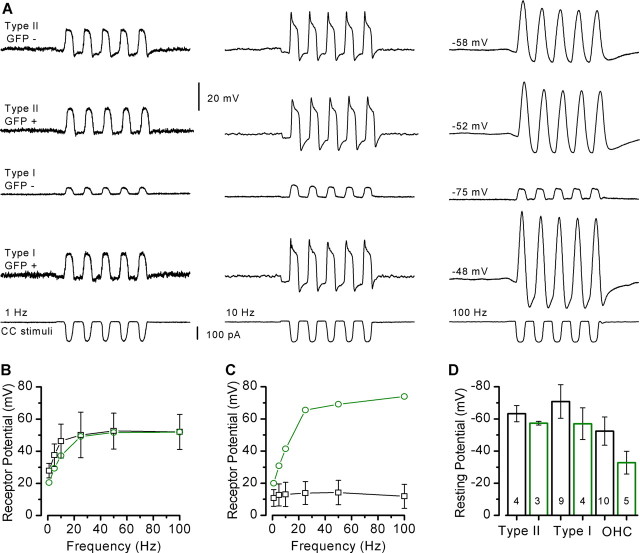
Figure 9.
Receptor potentials recorded in current-clamp mode from vestibular hair cells. A, Previously recorded transduction currents, evoked by sinewave bundle deflections, were used as current stimuli injected into GFP-negative and -positive type II and type I hair cells. The stimulus protocols shown in the bottom row of traces were delivered at 1, 10, and 100 Hz, as indicated for each column of traces. The cell type and condition is shown on the left for each row of traces and the resting membrane potential is shown on the right. The scale bar applies to all voltage traces. B, Mean peak-to-peak receptor potentials were measured for GFP-negative and -positive cells and plotted as a function of stimulus frequency for seven type II hair cells. Error bars are SD. C, Mean peak-to-peak receptor potentials for seven type I hair cells. D, Mean ± SD resting potentials are plotted for six populations of cells: GFP-negative (black) and GFP-positive (green) type II cells (left), type I cells (middle), and outer hair cells (OHC; right). Cultured and acute outer hair cell data were pooled. The number of cells is indicated within each bar.

