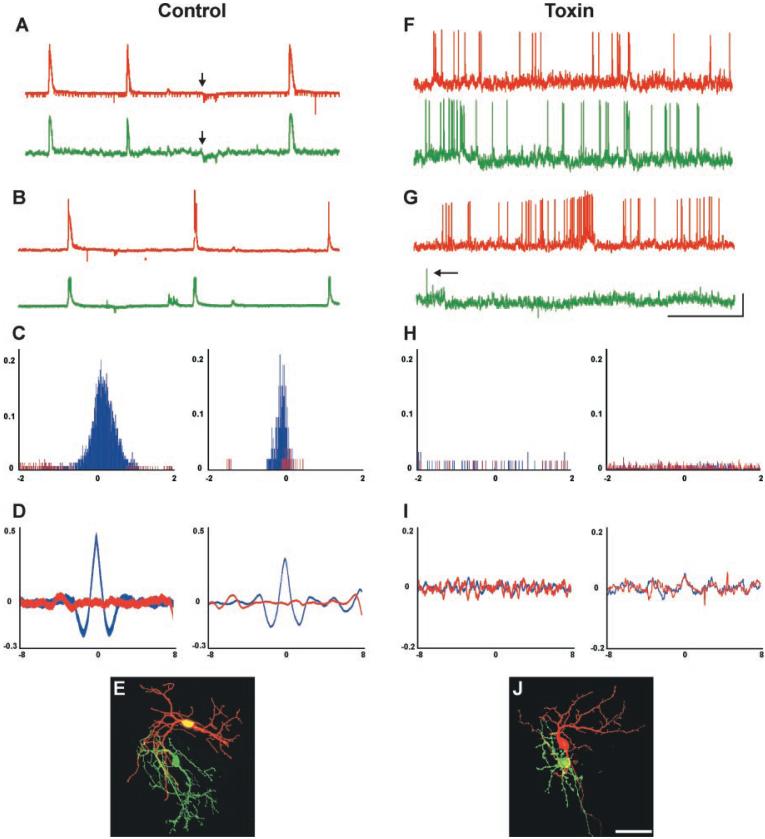
Fig. 4.
The normal pattern of neighboring ganglion cell activity is disrupted in toxin-treated retinas. (A and B) Examples of correlated activity from neighboring pairs of retinal ganglion cells in control retinas. Red trace, activity recorded from one ganglion cell; green trace, activity recorded from an adjacent ganglion cell (soma-soma recording distance <25 μm). (A) Patch-clamp recordings from a pair of neighboring ganglion cells, showing highly correlated bursts as well as hyperpolarizations (arrows indicate start of hyperpolarization for each cell); hyperpolarizations were seen in about half of the control cell pairs. These occurred at equal frequency in the toxin-treated retinas but were not correlated between neighboring cells (age shown = P4; Vm = -58 mV and -61 mV ). (B) Patch-clamp recordings from a different pair of neighboring ganglion cells in a control retina, again showing highly correlated bursting activity (age = P6; Vm = -66 mV and -68 mV). (C) Cross-correlation histograms of spiking activity for neighboring ganglion cells in two control retinas (left panel, P3 retina; right panel, P5 retina). Spiking activity is shown in blue; for comparison, a random-shuffle correlation of the same spike data is shown in red. Pearson correlation coefficient (r) values are shown on the y axis; time lag (in seconds) is shown on the x axis. Peaks are highly significant for these, as well as all other control ganglion cell pairs (table S1). Recording duration, 10 min. (D) Cross-correlation histograms of membrane potential for two neighboring ganglion cells in control retinas (ages = P3 and P4). Membrane correlation plot is shown in blue; for comparison, a random-shuffle correlation of the same data is shown in red. Pearson correlation coefficient (r) values are shown on the y axis; time lag (in seconds) is shown on the x axis. Highly significant peaks are evident near zero offset for these, as well as all the other control ganglion cell pairs in which only one cell spiked (table S2). (E) Control ganglion cells filled with Alexa dyes during a paired-patch-clamp recording session. Scale bar, 50 μm. (F and G) Patch-clamp recordings from pairs of neighboring ganglion cells in toxin-treated retinas. (F) High-frequency uncorrelated spiking activity was present in these two neighboring ganglion cells (age = P2; Vm = -60 mV and -59 mV). (G) Spontaneous activity in a pair of neighboring ganglion cells in a different toxin-treated retina. High-frequency activity was recorded in one cell, whereas very infrequent activity was recorded in an adjacent ganglion cell (age = P7; Vm = -67mV and -65 mV). Arrow indicates a single action potential. Horizontal scale in (A), (B), (F), and (G) = 1 min; vertical scale = 20 mV. (H) Cross-correlation histograms of spiking activity for two different toxin-treated pairs of neighboring ganglion cells (ages = P3 and P4). Spiking activity is shown in blue; a random-shuffle correlation of the same spike data is shown in red. Pearson correlation coefficient (r) values are shown on the y axis; time lag (in seconds) is shown on the x axis. The correlations for these as well as all other spiking pairs of ganglion cell pairs in toxin-treated retinas were not statistically significant (table S1); recording duration, 10 min. (I) Cross-correlation histograms of membrane potentials for two neighboring ganglion cells in a toxin-treated retinas (ages = P3 and P6). Membrane correlation plot is shown in blue; for comparison, a random-shuffle correlation of the same data is shown in red. Pearson correlation coefficient (r) values are shown on the y axis; time lag (in seconds) is shown on the x axis. In these as well as the other toxin-treated ganglion cell pairs in which only one cell spiked, correlations were not statistically significant (table S2). (J) Toxin-treated ganglion cells filled during a paired-patch-clamp recording session. Scale bar, 50 μm.

