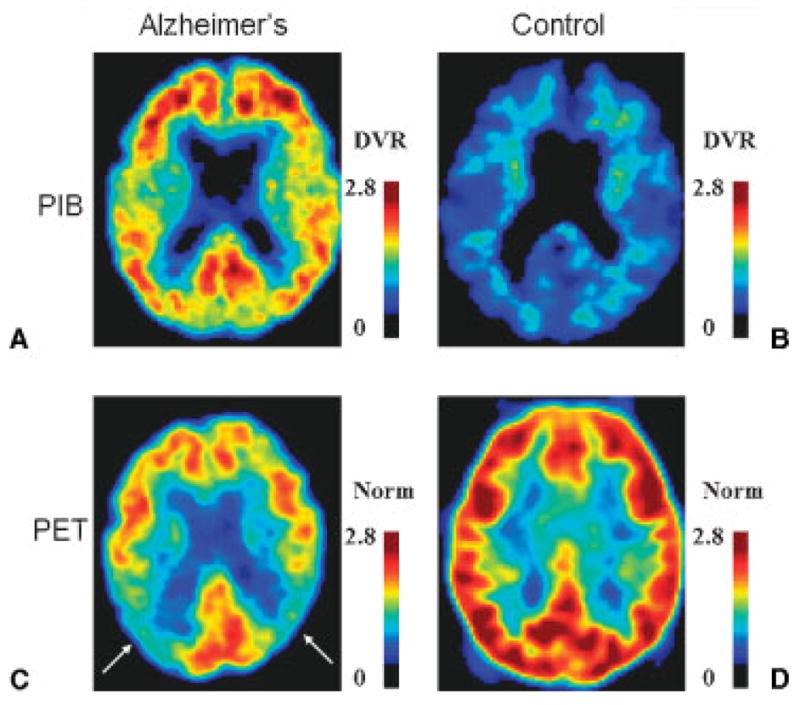
Figure 2.

Molecular and functional PET in (A,C) a patient with AD and (B,D) a healthy control. PET neuroimaging with the Aβ amyloid ligand Pittsburgh Compound-B in (A) a 67-year-old man with moderate AD and (B) a 73-year-old cognitively normal woman. Axial DVR images referenced to the cerebellum are shown in neurologic orientation. (A) The patient with AD has increased tracer binding in the frontal, posterior cingulate, parietal and temporal cortices, and the striatum (not shown). (B) In contrast, the cognitively normal control does not demonstrate tracer uptake in the cortex. (C,D) Fluorodeoxyglucose PET in the same subjects. Axial images normalized to mean activity in the pons (Norm) are presented in neurologic orientation. (C) The patient with AD demonstrates prominent hypometabolism, particularly in parietal cortex (arrows), while (D) the normal control shows normal glucose metabolism. (Images courtesy of Gil Rabinovici, University of California, San Francisco, and William Jagust, University of California, Berkeley.) PET, positron emission tomography; AD, Alzheimer’s disease; DVR, distribution volume ratio.
