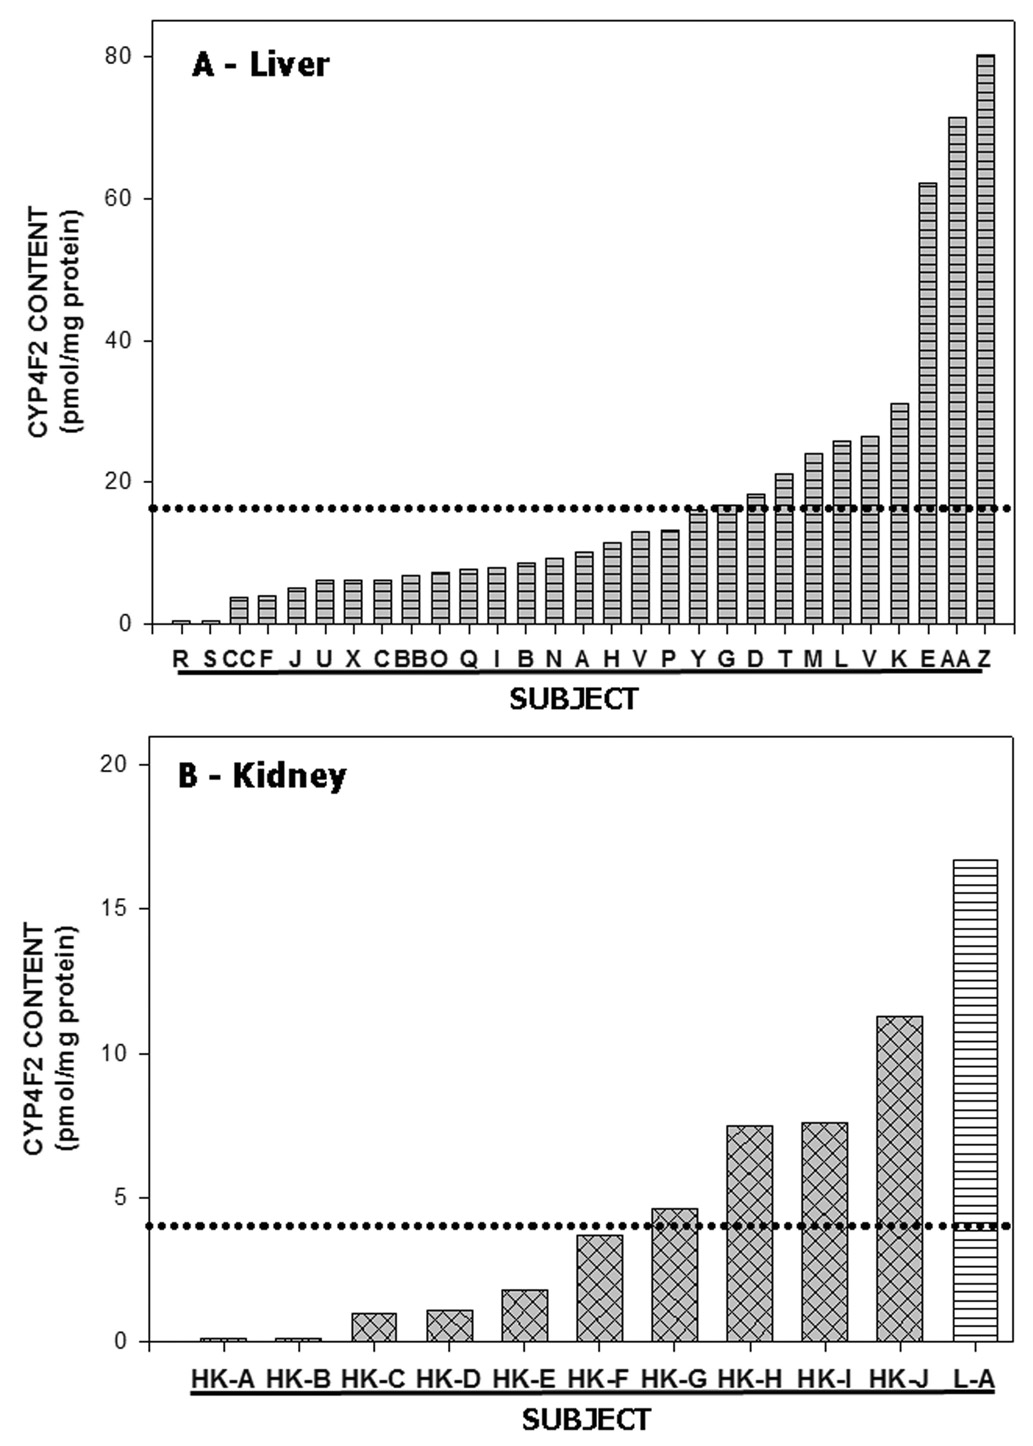
Figure 4. Variability of CYP4F2 expression in human liver and kidney cortex.
Panel A. CYP4F2 content was quantitated in liver microsomes obtained from 29 different subjects (A thru CC) using Western blots similar to those shown in Figure 3. The dotted line denotes the mean hepatic CYP4F2 content (16.4 pmol/mg protein) noted among the 29 subjects. Hepatic CYP4F2 levels in subjects R and S were below the level of detection. Panel B. Same as Panel A except that the CYP4F2 content in kidney cortical microsomes from 10 different subjects is shown. The column marked L-A depicts the CYP4F2 content in liver microsomes from subject G above while the dotted line denotes the mean renal CYP4F2 content (3.9 pmol/mg protein; n =10). CYP4F2 levels in kidney cortex from subjects HK-A and HK-B were below the level of detection.

