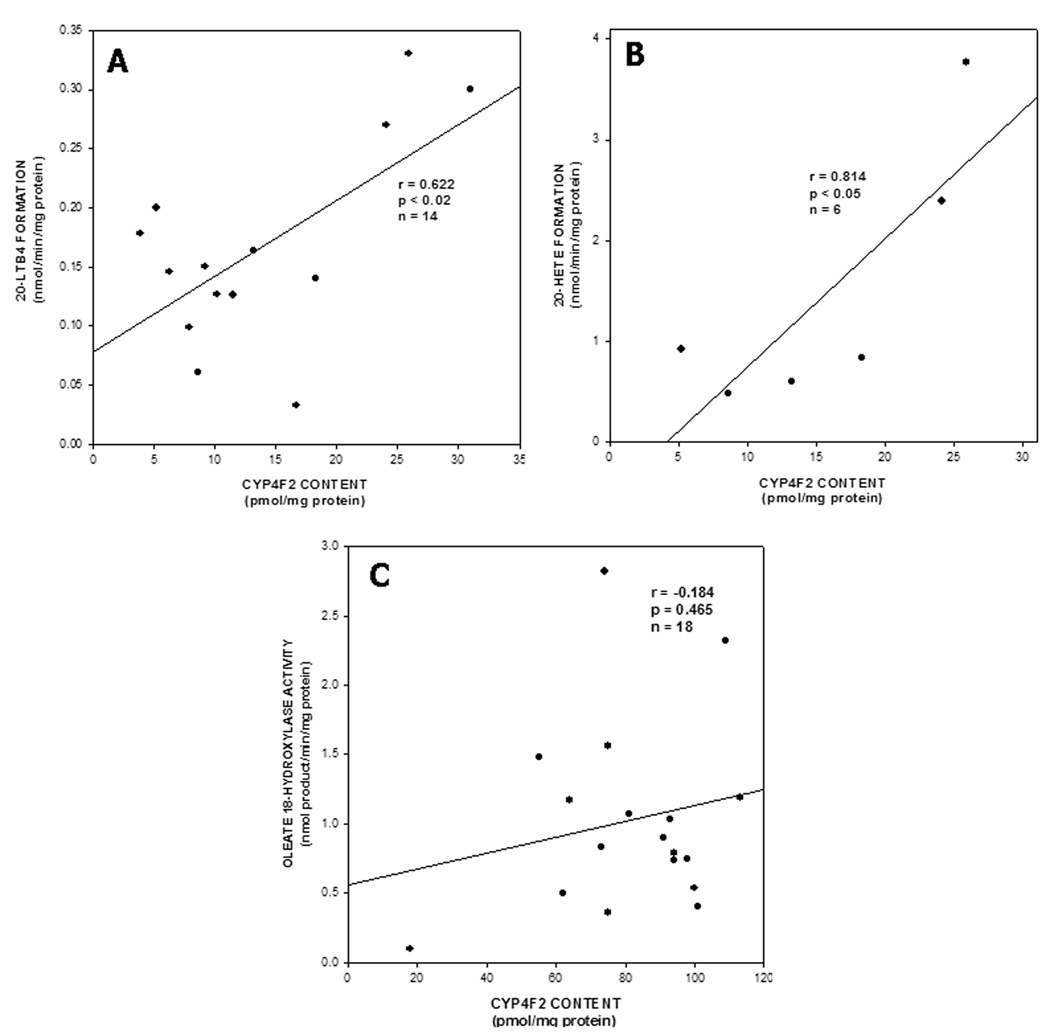
Figure 5. Correlation between CYP4F2 content and ω-hydroxylation of LTB4, AA and oleate in human liver microsomes.
CYP4F2 expression in hepatic microsomes from the different subjects was determined by quantitative immunoblotting (see Fig. 3) while rates of 20-OH LTB4 (Panel A), 20-HETE (Panel B), and 18-OH oleate formation (Panel C) by the same liver samples were measured as described in Materials and Methods. In each case, the correlation coefficient (r) was derived from the line of best fit by regression analysis, and a test of slope was used to determine the level of significance (p).

