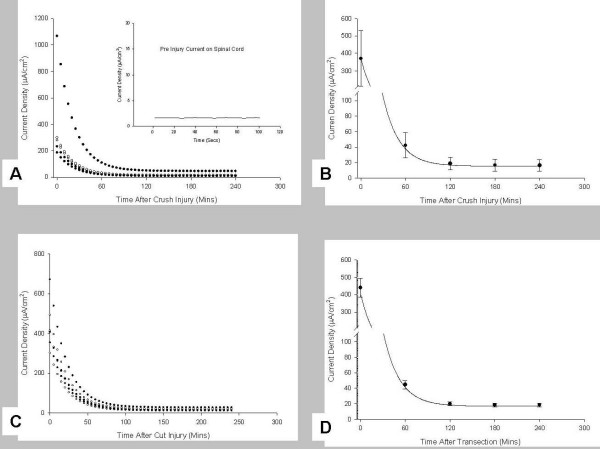
Figure 2.
Decline in peak current density with time after injury. A shows scatter plots of raw data on 5 individual spinal cords for the first 4 hours after a crush injury, while B shows the Mean and SEM of these same data. Note that one cord produced over 1 mA/cm2 of electric (ionic) current entering the lesion. C and D are similar plots, but derived from measurements made on transected spinal cords. Note the initial current densities are similar, but transected spinal cords appear to have a higher magnitude of stable current entering the transection site relative to crush injuries. All measurements were made 50 μm from the injury sites. These raw data were then corrected using a modified three parameter exponential decay model to determine the injury current densities at the surface of the cord. Pre-injury currents along all of these spinal cords were the same as background (See Fig 1). The background current was offset by taking a reference measurement before actual injury currents were begun. Inset in A shows a representative pre-injury current measurement made on the spinal cord in A. All of these measurements were made on ventral regions of the spinal cord.

