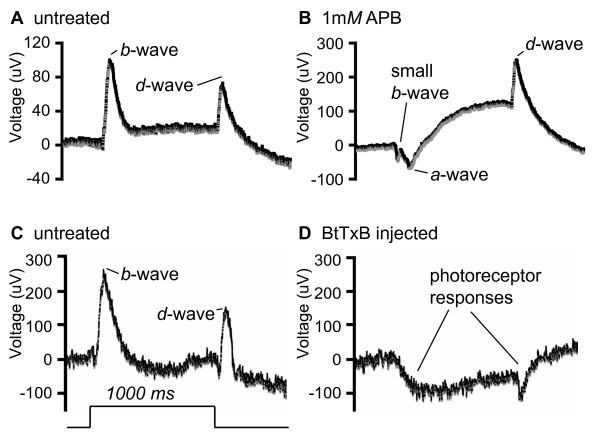
Figure 4.
Electroretinograms of APB- and BtTxB-treated larvae. Representative averaged traces of larval responses to a 1s pulse of bright light. Note that absolute voltage is a function of electrode placement on the eye; these traces are best interpreted by comparing the amplitude of the downward a-wave to the upward b-wave, and the on to the off response. (A, B) Responses of untreated control and 1 mM APB treated larvae, in μV. (C, D) Responses of uninjected control and BtTxB injected larvae, in μV. Time course of light step stimulus is shown at the lower left.

