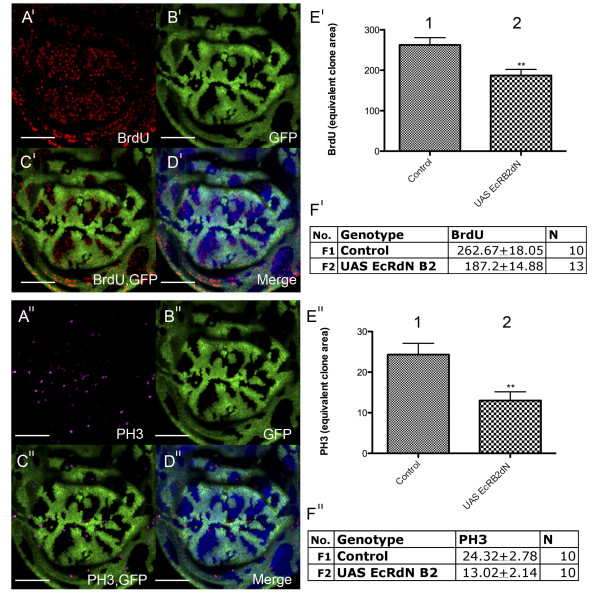
Figure 4.
EcR signaling is required for cell cycle progression in the wing disc. (A'-D') Overexpression of UAS-EcRBdN in flip out clones [108] (A') BrdU (red) (B') GFP (green) positively marks clones (C') Overlay of GFP and BrdU (D') Merge of GFP and BrdU with DNA (DAPI) staining (blue) to show the nuclei of apical cells in the wing pouch. (E') Quantification of S-phase in clones overexpressing UAS-EcRBdN (E2'), and in an equivalent clone area of control tissue (E1'). A significant reduction (p = 0.0038) in S-phase was observed for UAS-EcRBdN compared to the control. (F1') Mean number of BrdU (S-phase) cells ± SEM for the control and (F2') for UAS-EcRBdN. (A"-D") Overexpression of UAS-EcRBdN (A") PH3 staining (purple) (B") GFP (green) positively marks clones (C") Overlay of GFP and PH3 (D") Merge of GFP and PH3 with DNA (DAPI) staining (blue). (E") Quantification of mitosis in clones overexpressing UAS-EcRBdN (E2"), and in an equivalent clone area of control tissue (E1"). A significant reduction (p = 0.0047) in the number of mitotic cells was observed for UAS-EcRBdN compared with the control. (F1") Mean number of PH3 cells ± SEM for the control and (F2") UAS-EcRBdN. Scale bars indicate 50 μm. N = sample size.

