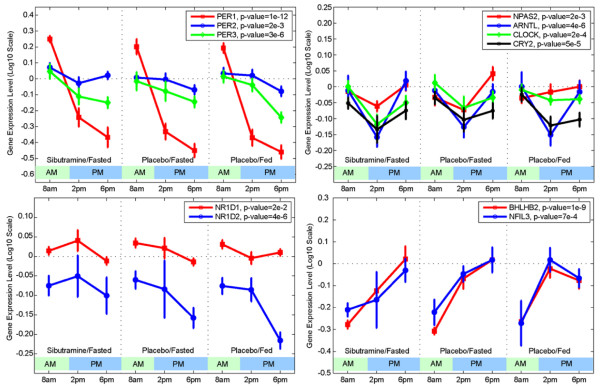
Figure 3.
Temporal profiles of gene expression changes for several core circadian genes [50]. Each panel illustrates the mean gene expression level (± standard error) across the cohort of patients at 8 am, 2 pm, and 6 pm by treatment arm. The genes are grouped into panels by their temporal profiles and/or similar biological functions. The top left panel shows profiles for PER1, PER2, and PER3 genes. The p-value for time-dependent change is determined by two-way ANOVA for time and patient. Although all three genes show time-dependent changes and consistently have high levels in the morning and low levels in the afternoon across three periods, change in PER1 has the largest amplitude and significance among all core circadian genes. NR1D1 and NR1D2, shown in the bottom left panel, have downward trends, especially from 2 to 6 pm. The genes shown in the top right panel have relatively small temporal changes characterized by a dip at 2 pm, relative to 8 am and 6 pm measurements. The genes in the bottom right panel have a robust upward trend.

