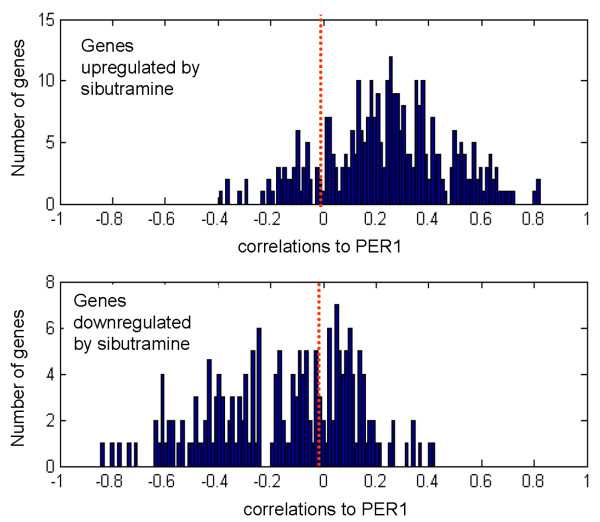
Figure 7.
Differentially regulated genes between the sibutramine treated arm and the fasted arm (both arms started the procedure in a fasted state) at the 10 hour time point. The top panel shows the correlations to PER1 of genes that are upregulated by sibutramine. The bottom panel shows the correlations to PER1 of genes that are downregulated by sibutramine. The red dotted line marks the zero point. Y-axis: number of genes. X-axis: correlations to PER1.

