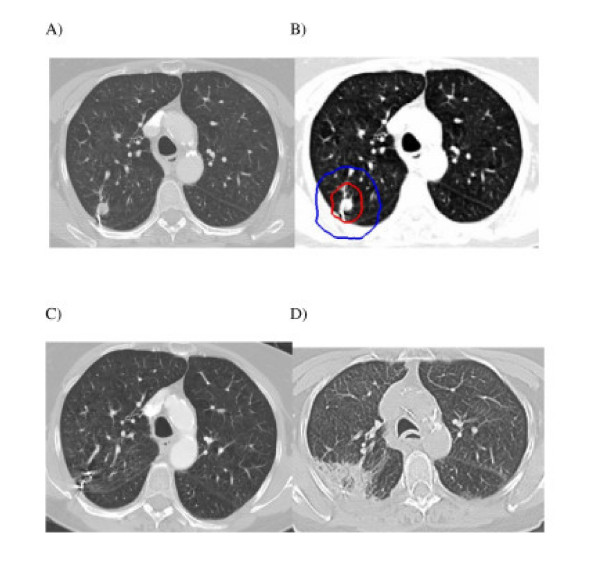
Figure 1.
Right upper lobe clinical stage IA NSCLC treatment planning CT (A), planned radiation dose distribution (B: the planning treatment volume is shown in red and the 30 Gy isodose line in blue), and CT at 3 and 6 months post-treatment (C and D) show an initial decrease in the tumor volume followed by radiation fibrosis which correlates with the planned dose distribution, engulfs the fiducials and impedes evaluation of tumor response.

