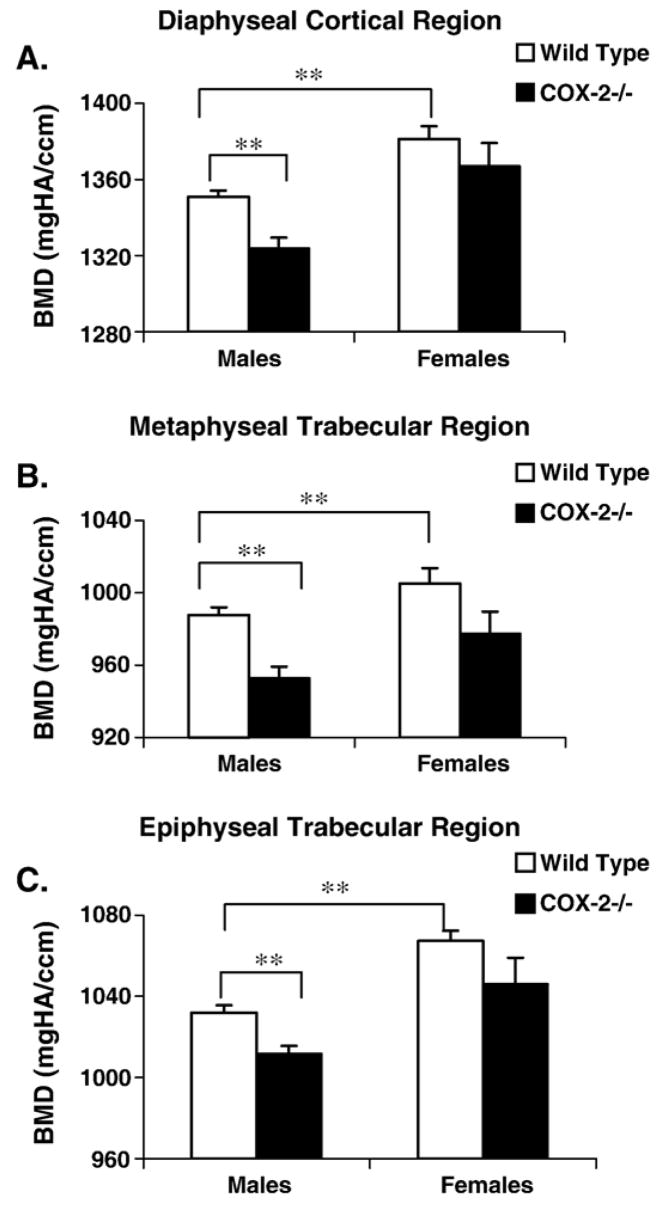
Fig. 2.
Bone mineral densities for male and female mice in the cortial, metaphyseal and epiphyseal regions. Samples were scanned by micro-CT and the values were converted into mineral densities following calibration with hydroxyapatite (HA) phantoms of known densities (mg HA/cm3). Data shown represent mean ± SEM. ** indicates significance (P < 0.01).

