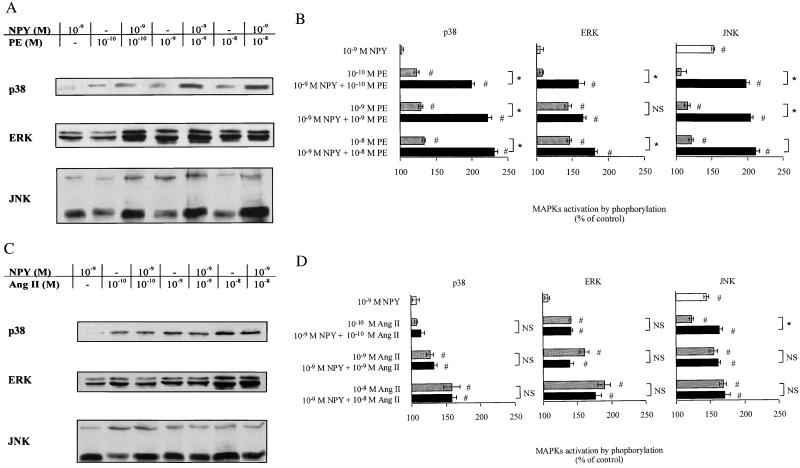
Figure 2.
Effect of NPY pretreatment on PE- and Ang II-induced MAPK activation. (A and C) Detection of MAPK by Western blot analysis. (B and D) Quantification of PE- and Ang II-mediated MAPK activation after NPY treatment. Primary cardiomyocytes were treated with NPY and then stimulated by various concentrations of either PE (A and B) or Ang II (C and D). Phosphorylation of p38, ERK, and JNK was detected by using specific antibodies. Autoradiographic bands were quantified by laser-scanning densitometry. Results represent percent increase as compared with unstimulated control. Values are expressed as mean ± SEM (n = 3); *, P < 0.05 as compared with the indicate group. NS, not significant; #, P < 0.05 as compared with control.

